Service Line Profitability report (2020.3.4)
Why use this feature
The Service Line Profitability report includes a series of reports that allows you to determine the actions needed to optimize profitability of your organization by reducing cost compared to internal peer groups. The report package includes the following:
NOTE: These reports cannot be edited using the Axiom Intelligence report editor.
IMPORTANT: If you are not using the new Service Line Schemas utility available in this release, the report will default to primary service from the schema line structure available pre-2020.3.
How this feature works
What: Use this report to see profitability changes for service lines, net income of physicians, and model profitability scenarios.
Where: From the Enterprise Decision Support home page, in the Reporting section, click Report Builder. In the Axiom Intelligence Reports section, click Service Line Profitability.
Who: Users must be assigned the DSS Admin role profile in the system.
How: The package includes the following reports:
Profitability by Service Line
This interactive report allows you to see the profitability changes for a selected date range and compare the results to the previous year for all or specific service lines. You can click any of the service lines to see the percentage change for that specific service line. In the upper right corner of the page, you can select the entity, patient type, and date range to include in the report.
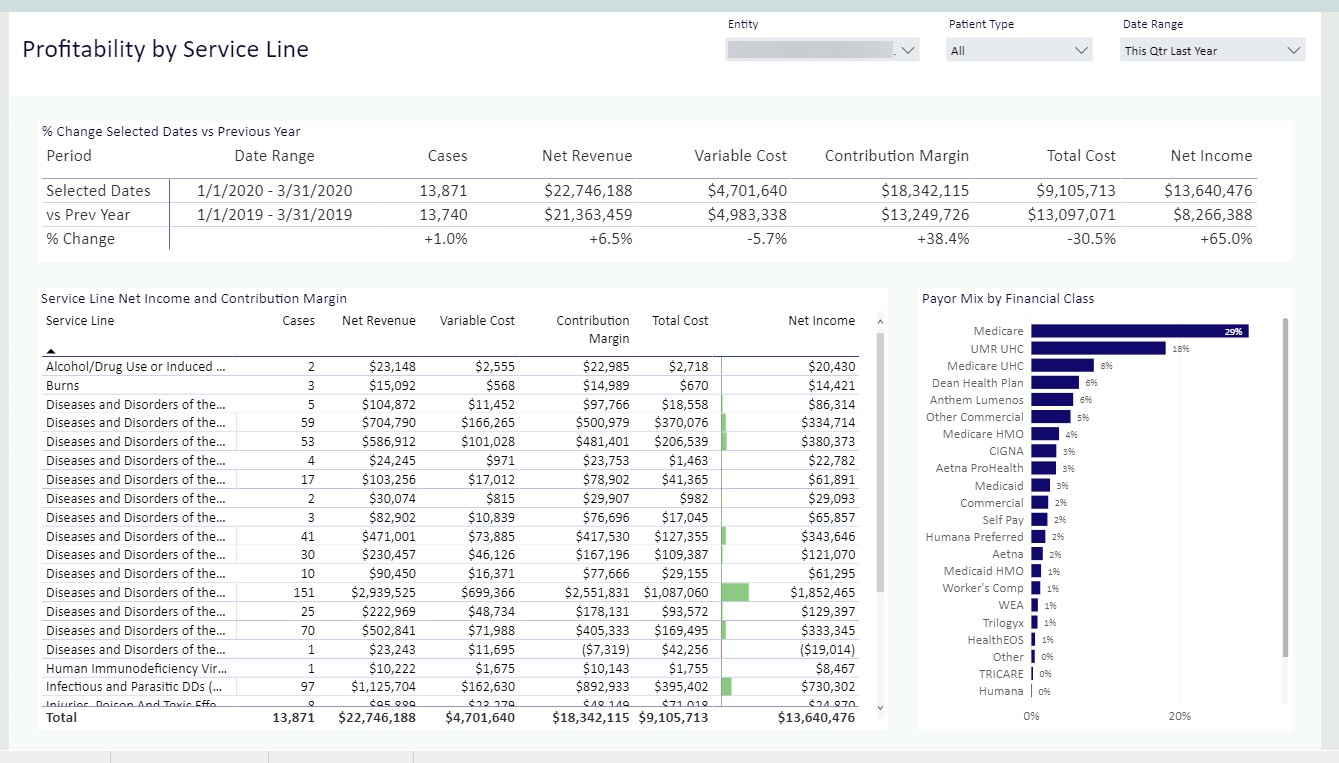
The Profitability by Service Line report shows the percentage change for selected dates and from the previous year
Service Line Summary
This interactive report allows you to drill down to a specific service line to see the profitability by payor, patient origin, measures, and profitability at the physician level. In the upper right corner of the page, you can select the entity, service line, patient type, and date range to include in the report.
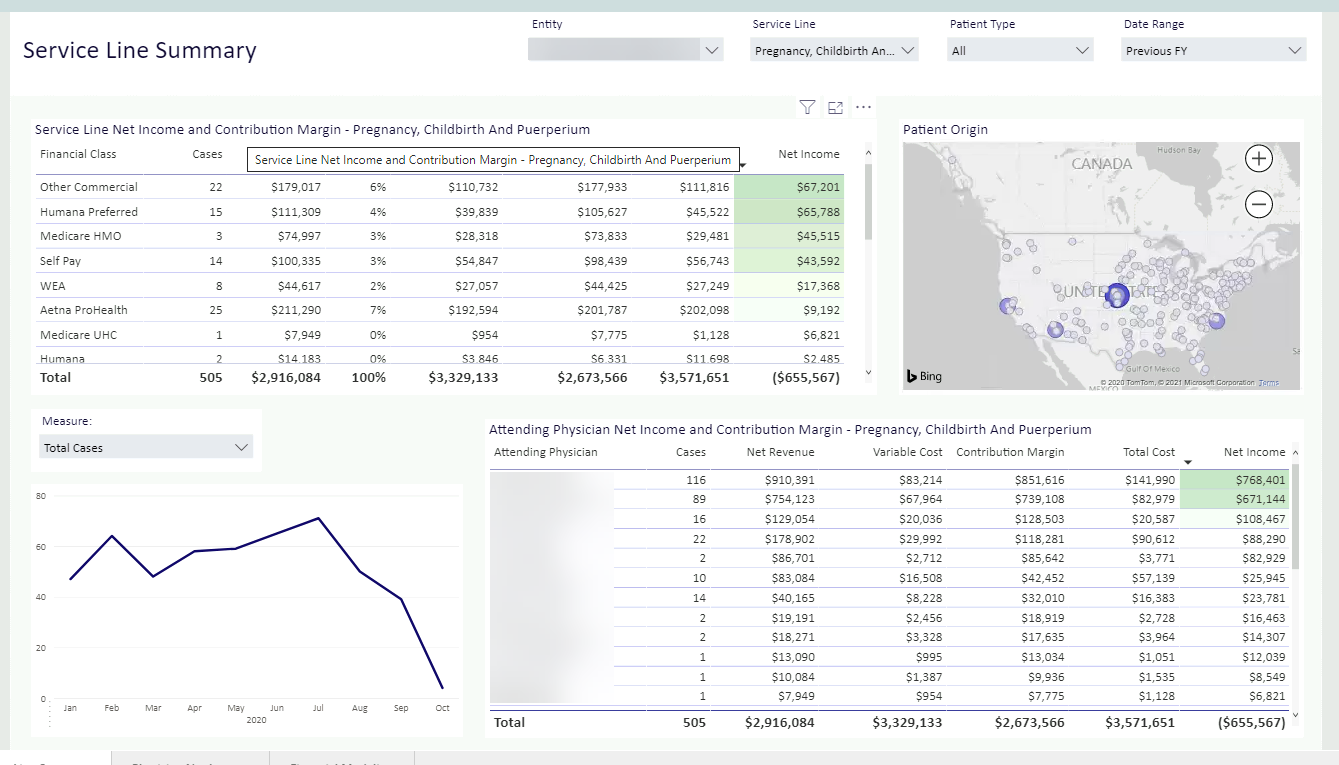
View the details regarding profitability at the service line level
Physician Net Income
This interactive report allows you to see the net income for your physicians. Using the Min Cases fields, you can eliminate your lows by setting the minimum number of cases to include in the report. You can click the bar graph for each physician to see their income details by their specific DRG/diagnosis/procedure and payors. In the upper right corner of the page, you can select the measure, service line, patient, and date range to include in the report.
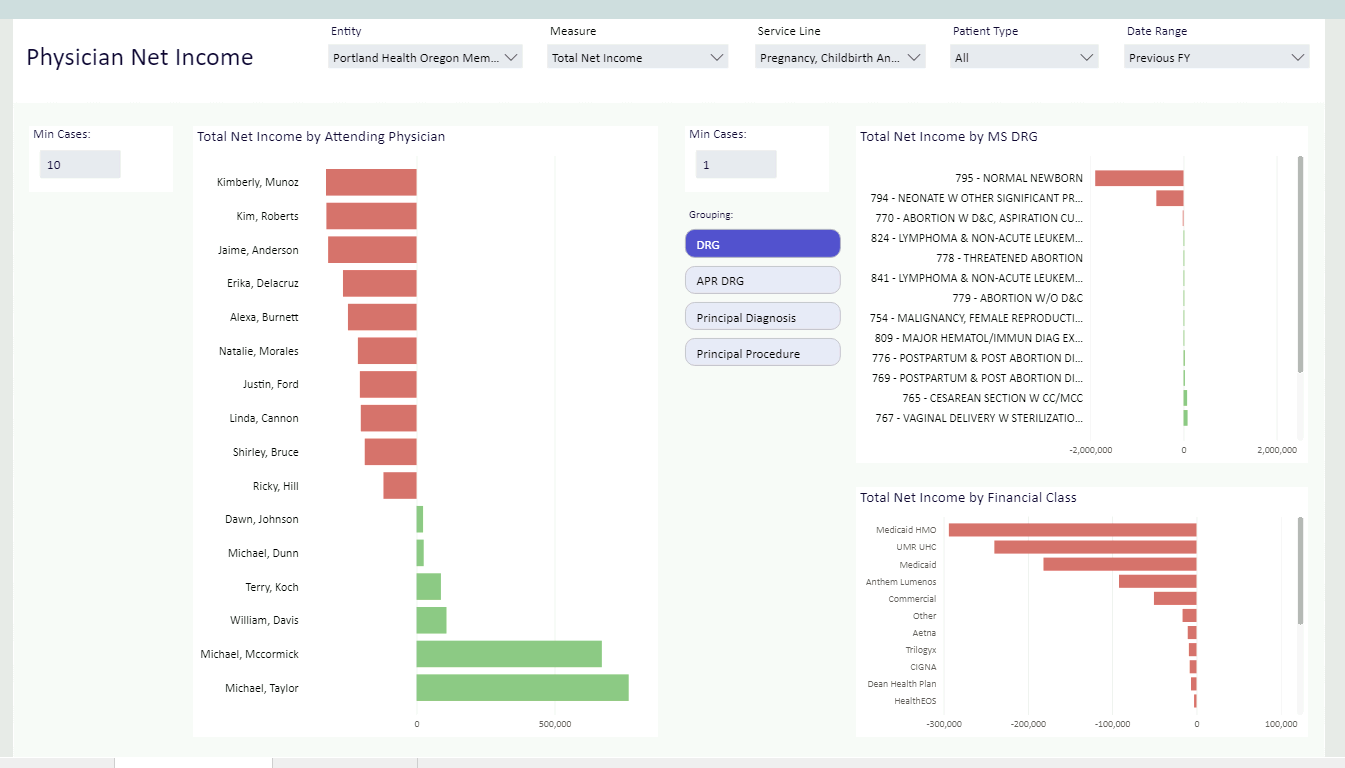
Easily see the profitability details for each physician
Financial Modeling
This interactive report allows you to model profitability scenarios by service line and payors.
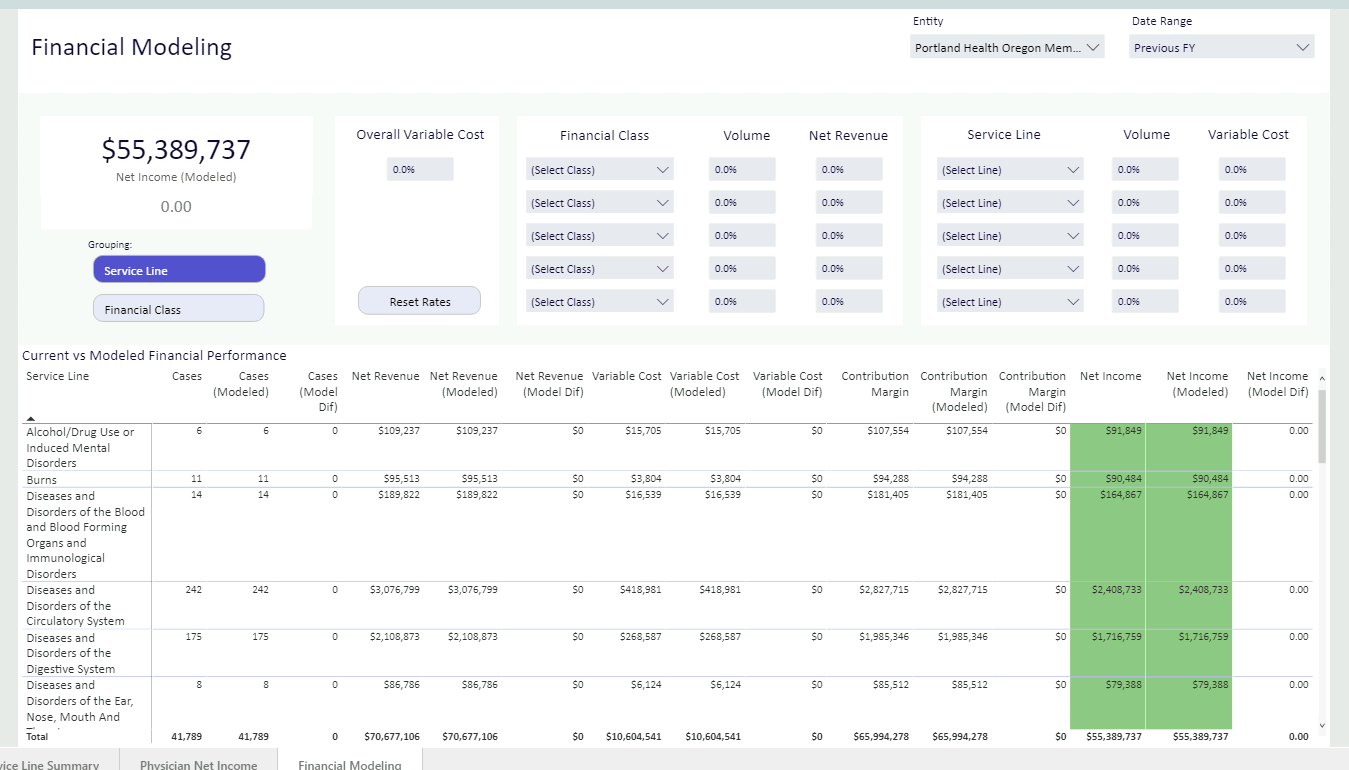
Profitability modeling for service lines and payors
